Introduction
KPI dashboard software plays a crucial role in today’s competitive business landscape, where financial Key Performance Indicators (KPIs) are essential for measuring economic health, forecasting growth and guiding strategic decisions. For organizations with complex financial structures, understanding and leveraging advanced financial KPIs is vital. This article explores the most important financial KPIs, their impact on decision-making and how businesses can use them to optimize performance and achieve long-term success.

What Are Financial KPIs?
Financial KPIs are metrics used to evaluate the financial performance of a business and KPI dashboard software helps centralize and analyze these indicators for clearer insights. These metrics reveal a company’s financial health and allow stakeholders to assess profitability, liquidity, efficiency and solvency. Advanced financial KPIs go beyond basic measurements, offering deeper analysis that supports high-level decision-making and strategic planning.
For Demo Dataspire KPI Information

Key Advanced Financial KPIs
Return on Invested Capital (ROIC)
ROIC is a core indicator of value creation. It measures how efficiently a company transforms invested capital into profit. A consistently high ROIC signals superior capital allocation, operational excellence and strategic discipline. For advanced analysis, ROIC is often benchmarked against a company’s weighted average cost of capital (WACC) to determine whether true economic value is being generated.
Earnings Before Interest, Taxes, Depreciation and Amortization (EBITDA)
EBITDA reflects a company’s operating performance by isolating profitability from financing and accounting decisions. Analysts frequently use EBITDA to assess core operating strength, compare performance across industries and evaluate acquisition opportunities. A strong EBITDA margin indicates efficient cost management and stable operational output.
Free Cash Flow (FCF)
Free Cash Flow (FCF) represents the cash available after capital expenditures cash that can be reinvested, used to pay down debt or distributed to shareholders. KPI dashboard software helps visualize and track FCF trends, making it easier for analysts to identify long-term patterns and financial stability. Advanced analysts prioritize FCF because it directly impacts valuation models and growth potential. Sustainable FCF growth is often a sign of strong leadership and sound financial planning.
Net Profit Margin (NPM)
Net Profit Margin measures how much actual profit remains after all expenses are deducted. It provides insight into cost efficiency, scalability and bottom-line performance. For advanced assessments, NPM trends over time reveal the effectiveness of pricing strategies, cost control and competitive positioning.
Return on Equity (ROE)
ROE measures how effectively a company converts shareholder equity into profit. High ROE typically indicates strong management performance and an efficient equity structure. For deeper analysis, ROE is often broken into components using the DuPont model to separate the effects of leverage, asset turnover and operating efficiency.
Debt-to-Equity Ratio (D/E)
The Debt-to-Equity ratio measures a company’s reliance on debt financing and KPI dashboard software helps track this metric in real time to assess financial stability. A high ratio increases financial risk but may also amplify returns if the business generates consistent cash flow. Analysts often evaluate D/E alongside interest coverage ratios to understand leverage sustainability and overall risk exposure.

Advanced Financial KPIs with KPI Dashboard Software
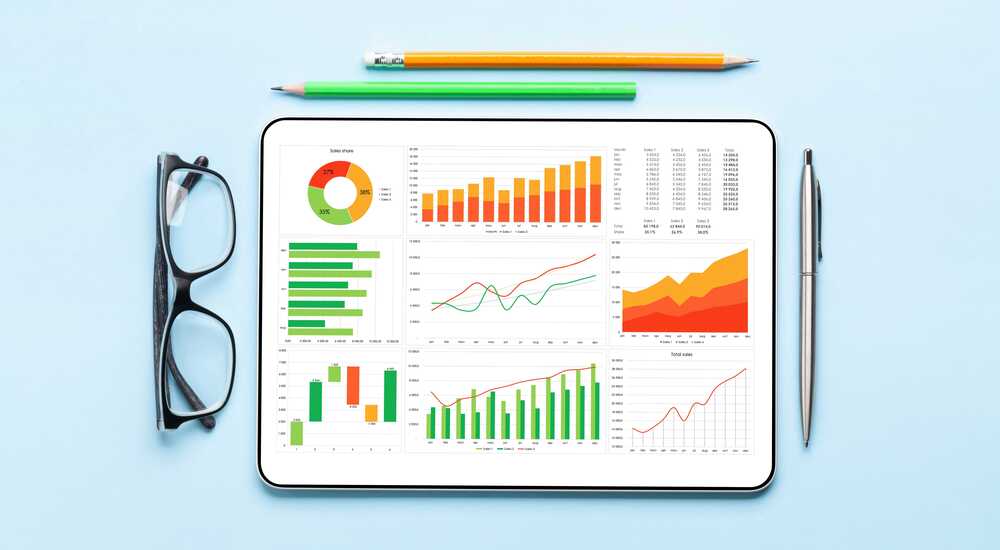
Tracking advanced financial KPIs can be complex due to the volume of data, multiple sources and constantly changing market conditions. KPI dashboard software helps streamline this process by centralizing data, providing real-time insights and visualizing trends. However, even with advanced tools, ensuring data accuracy, consistency and proper interpretation remains a key challenge for businesses aiming to make informed decisions.
Conclusion
Advanced financial KPIs provide a comprehensive view of a company’s financial health and are essential for making informed, data-driven decisions. KPI dashboard software enables businesses to track key financial metrics such as ROIC, EBITDA and Free Cash Flow in real time, helping optimize performance, reduce financial risk and ensure sustainable growth. As financial markets evolve and businesses become more complex, understanding and effectively using advanced financial KPIs with the right tools will remain critical for driving long-term success.
